
Program Roadmap: Sequence Components by Benefit Date
A program roadmap is a chronological view of a program’s components, dependencies, gates and benefit dates. Build it by working backwards from the date each benefit lands, then run a slip test to see which benefits move when a component slips.

By Sanjeev Kumar, Founder · Updated 4 Nov 2026

Key takeaways
- A program roadmap puts each component's delivery date next to the date its benefit is expected, with an owner for each. Sequence from the benefit date backwards, not from project start dates forwards.
- The gap between delivery and benefit is not constant. In our example it is one to two quarters, but a one-quarter slip becomes four quarters when the benefit is tied to a fixed date such as a licence renewal.
- Test the sequence by moving each component one quarter and listing the benefits that move. In our example, a one-quarter delay to warehouse scanning moves two benefits and costs ₹2.4 crore in our model.
- Put non-project work in the table. In our example, data clean-up and dealer training are 10% of spend (₹3 crore of ₹30 crore), and all four benefits sit downstream of the clean-up.
In this article
- 1What is a program roadmap, and how does it differ from a project schedule?
- 2What does a benefit-sequenced roadmap look like?
- 3Which benefit slips if a component moves? Run the slip test
- 4How do you build a roadmap in six steps?
- 5Why do roadmaps fail?
- 6Which Augment Consultancy course gives a foundation for program roadmaps?
- 7Frequently asked questions
Ask a sponsor when each benefit arrives and who answers for it, and most roadmaps go quiet. A timeline of six projects with the word “strategy” above it shows delivery dates, not benefit dates.
That gap is expensive. In our ₹30 crore example, a one-quarter slip in warehouse scanning pushes the legacy shutdown past a 31 December licence renewal. A three-month delay then costs a full year of a licence saving, ₹2.4 crore in all. A project timeline would not show that.
Here is the fix. Build the roadmap backwards from each benefit date, with a named owner for each, using a copyable ₹ crore table. Then run the slip test: move each component one quarter and list every benefit that moves.
What is a program roadmap, and how does it differ from a project schedule?
A program roadmap is the chronological view of a program's components, the dependencies between them, the gates where decisions are taken, and the date each benefit is expected. A project schedule lists tasks until one deliverable is handed over. A program roadmap continues past delivery, to the date the benefit shows up in the business.
Some terms, defined once:
- A program is a group of related projects and work managed together to obtain benefits that managing them separately would not.
- A benefit is a measurable improvement the organisation gains, such as cash released or cost removed.
- A gate is a formal decision point at which the sponsor decides whether to continue, change or stop.
The level of detail also differs. A project schedule works in days and tasks. A program roadmap works in quarters and components.
A paper in the Project Management Institute (PMI) library, presented at the PMI Global Congress 2015, names as a best practice a roadmap that sets out the interdependencies between work under way and the milestones for when each benefit is to be realised (Levin, PMI Global Congress paper, 2015).
Two scope notes. This page covers a single program. Portfolio management decides which programs and projects to fund, and our guide to how program and portfolio management differ covers that decision. How several agile teams share one program outcome is covered in our guide to agile program management.
| Roadmap | Project roadmap | Program roadmap | Portfolio roadmap |
|---|---|---|---|
| Shows | Phases and deliverables of one project | Components of one program, with dependencies, gates and benefit dates | Programs and projects across the organisation |
| Benefit dates | Usually not shown | Shown, each with an owner | Summarised by program |
| Question it answers | Is this project on plan? | Which benefit moves if a component moves? | What do we fund, pause or stop? |
What does a benefit-sequenced roadmap look like?
A benefit-sequenced program roadmap is a table with one row per component. Each row shows what the component needs first, which benefit it enables, who owns the component, when it delivers, when the benefit lands and who owns the benefit. Copy the columns into a spreadsheet and you have the template.
The program below is our illustration, not data from a real program. It is a ₹30 crore order-to-cash modernisation for a dealer network. It starts in the first quarter (Q1) of financial year 2028 (FY28), which is April to June 2027 in the Indian financial year (April to March). It has four benefits:
- B1: billing cycle cut from 11 to 4 days, releasing ₹6 crore of working capital once. This is our assumption: invoices go out 7 days sooner, so cash arrives 7 days sooner. At about ₹313 crore of annual dealer billing, 7 days of billing is about ₹6 crore (313 × 7 ÷ 365).
- B2: ₹3.2 crore a year less claim leakage.
- B3: ₹2.4 crore a year lower warehouse picking cost.
- B4: ₹1.8 crore a year in retired legacy licence fees.
B1 cannot land before the quarter in which C5 (dealer training) delivers, and B2 lands two quarters after the later of C3 and C5.
The recurring benefits total ₹7.4 crore a year (3.2 + 2.4 + 1.8), plus the one-off ₹6 crore. Our assumptions for the lags are:
- B1 shows at the first full month-end close after go-live (one quarter).
- B2 shows after two claim cycles (two quarters).
- B3 shows two quarters after scanning goes live.
- B4 starts the first quarter after switch-off.
- The legacy licence renews each 31 December, with no early exit.
| Component (₹ crore) | Needs first | Enables | Component owner | Delivers | Benefit lands | Benefit owner |
|---|---|---|---|---|---|---|
| C1 Customer and item master clean-up, non-project work (1.5) | none | B1, B2 | Head of Sales Operations | Q1 FY28 | enabler only | n/a |
| C2 E-invoicing and order-to-cash workflow (12) | C1 | B1 | Head of IT | Q3 FY28 | Q4 FY28 | Head of Finance Operations |
| C3 Claims rules engine (4) | C1, C2 | B2 | Head of IT | Q4 FY28 | Q2 FY29 | Head of Sales Operations |
| C4 Warehouse scanning at 3 distribution centres (7) | C1 | B3 | Head of Logistics | Q2 FY29 | Q4 FY29 | Head of Distribution Finance |
| C5 Dealer training and change, non-project work (1.5) | C2 | adoption of B1, B2 | Change manager | Q4 FY28 | enabler only | n/a |
| C6 Legacy decommissioning (4) | C2, C3, C4 | B4 | Head of IT | Q3 FY29 (before 31 Dec 2028) | Q4 FY29 | Chief Information Officer |
The costs add up: 1.5 + 12 + 4 + 7 + 1.5 + 4 = ₹30 crore.
Quarter by quarter, the same example reads as follows. D means the component delivers. B1 to B4 mean the benefit lands. Q3 FY29 ends on 31 December 2028, the licence renewal date.
| Component | Q1 FY28 | Q2 FY28 | Q3 FY28 | Q4 FY28 | Q1 FY29 | Q2 FY29 | Q3 FY29 | Q4 FY29 |
|---|---|---|---|---|---|---|---|---|
| C1 Clean-up | D | - | - | - | - | - | - | - |
| C2 E-invoicing | - | - | D | B1 | - | - | - | - |
| C3 Claims engine | - | - | - | D | - | B2 | - | - |
| C4 Warehouse scanning | - | - | - | - | - | D | - | B3 |
| C5 Dealer training | - | - | - | D | - | - | - | - |
| C6 Decommissioning | - | - | - | - | - | - | D | B4 |
Read the table from the right-hand columns first. The component owner delivers the work. The benefit owner is the business leader whose numbers must change, and who confirms that the benefit has landed. They are rarely the same person. The register that records each benefit's owner and measure is covered in our guide to benefits realisation management, and the roadmap only sequences it.
Where the gates sit in the example. Gate 1 comes at the end of Q1 FY28, once C1 has delivered, to decide whether to release C2’s ₹12 crore, the largest spend. Gate 2 comes at the end of Q2 FY29, when C4 delivers: it is the last point before the 31 December 2028 renewal at which the sponsor can still protect the licence saving.
Which benefit slips if a component moves? Run the slip test
A one-quarter slip to C4 (warehouse scanning) costs the most, ₹2.4 crore in our model, because it pushes the legacy shutdown past the 31 December 2028 renewal. Move each component one quarter later, follow the dependencies, and write down every benefit whose date changes. A component's own benefit is only part of the answer. Successor components and fixed dates carry the rest.
Large programs often carry live delivery issues, so test the sequence. In the NISTA Major Projects Annual Report 2025-26, 109 of the 189 projects in the UK Government Major Projects Portfolio (58%) were rated Amber at the end of March 2026: delivery appeared feasible, but significant issues needed management attention. A further 34 (18%) were rated Red.
These are the government’s most complex projects and each rating is a snapshot, so read the figures as a warning about complexity, not a forecast.
The rule we apply is that a successor cannot deliver in the same quarter as its predecessor, so it must deliver in a later one. The money effect is our model:
- A quarter of a recurring annual benefit is the annual figure divided by four.
- The one-off B1 is costed at its carrying cost: ₹6 crore × 9% a year ÷ 4 = ₹0.135 crore (₹13.5 lakh). The 9% cost of funds is our assumption.
| One-quarter slip in | What moves | Cost in our model |
|---|---|---|
| C1 (Q1 to Q2 FY28) | Nothing. C2 still delivers in a later quarter. | ₹0 |
| C2 (Q3 to Q4 FY28) | B1 moves to Q1 FY29. C3 and C5 move to Q1 FY29, so B2 moves to Q3 FY29. C6 is unaffected. | 0.135 + 3.2 ÷ 4 (0.8) = ₹0.935 crore |
| C3 (Q4 FY28 to Q1 FY29) | B2 moves to Q3 FY29. | 3.2 ÷ 4 = ₹0.8 crore |
| C4 (Q2 to Q3 FY29) | B3 moves to Q1 FY30. C6 must follow C4, so it moves to Q4 FY29, after the 31 December 2028 renewal. B4 moves from Q4 FY29 to Q4 FY30, four quarters. | 2.4 ÷ 4 (0.6) + 1.8 = ₹2.4 crore |
| C5 (Q4 FY28 to Q1 FY29) | Adoption of B1 and B2 moves one quarter, so B1 moves to Q1 FY29 and B2 to Q3 FY29. | 0.135 + 0.8 = ₹0.935 crore |
| C6 (Q3 to Q4 FY29) | B4 moves four quarters, for the same reason. | ₹1.8 crore |
The most expensive row is not the largest component. C2 is the biggest spend at ₹12 crore, yet a quarter’s delay costs ₹0.935 crore. The ₹7 crore C4 costs ₹2.4 crore.
A project timeline shows C4 as a three-distribution-centre job with one benefit. The slip test shows it as the component that protects the licence saving. We would respond in one of two ways. Either pull C4 forward to Q1 FY29, which the model allows because it needs only C1, so that a quarter of float sits between C4 and C6, or ask the vendor for a shorter renewal term.
How do you build a roadmap in six steps?
A roadmap is built in six steps: benefits and owners, components, dependencies and fixed dates, backward sequencing, gates, and a review rule. Each step supplies the input for the next.
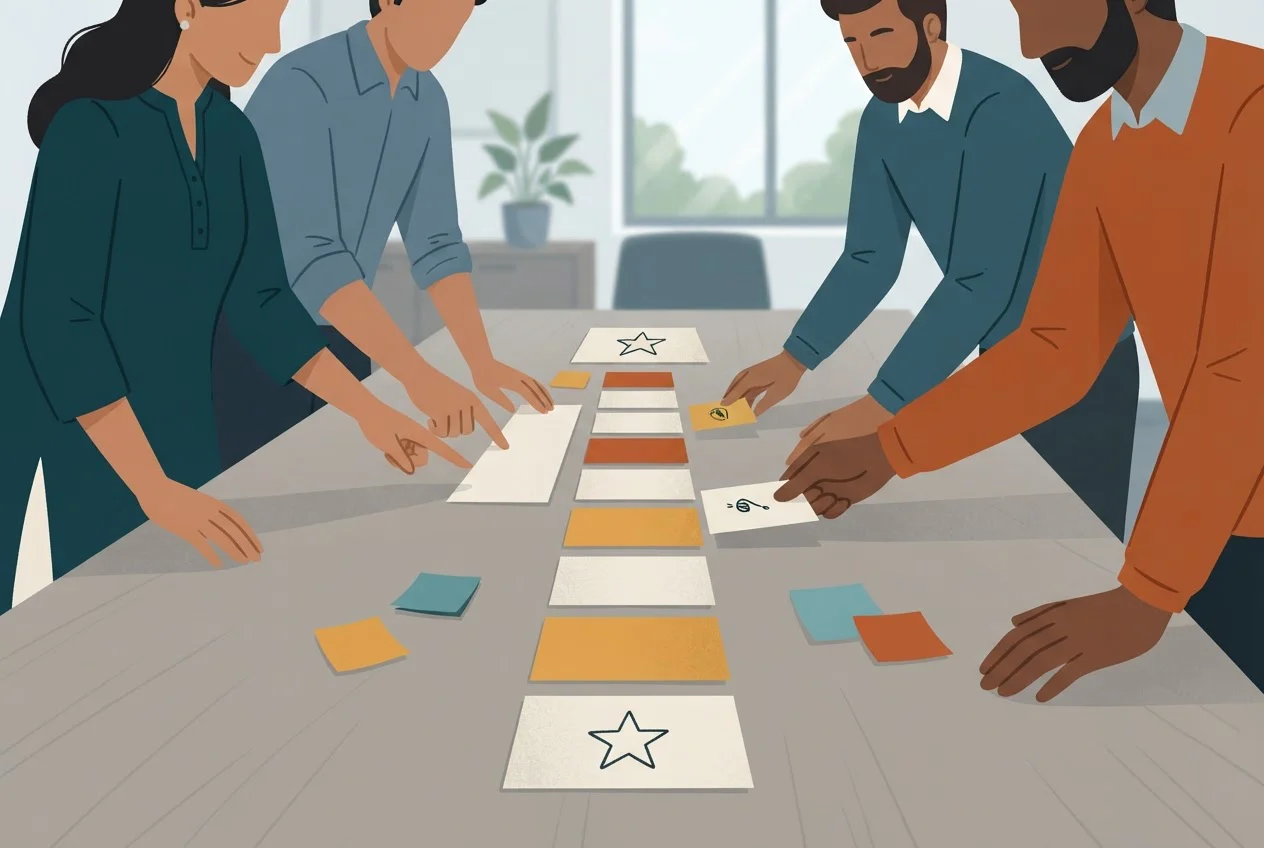
- List the benefits, each with one owner and a date window.Use the measure and owner from your benefits register.
- List every component, including non-project work.Each one must trace to at least one benefit, or be marked as an enabler for a named benefit. A component that does neither is a candidate to drop.
- Map dependencies and mark fixed dates.Record each predecessor and successor. Mark events that do not move: licence renewals, financial year end, regulatory deadlines and seasonal peaks.
- Sequence backwards from each benefit date.Take the benefit date and subtract its lag to get the latest date its component can deliver. Where two orderings are possible, we put the components with the shortest lag first, so that early wins arrive while sponsor attention is high. That is our recommendation, not a rule.
- Place the gates.
Put one before your largest spend (C2 is ₹12 crore, 40% of the example). Put another wherever a benefit owner takes over from the delivery team. Where the gates sit in the wider cycle is covered in our guide to the program management life cycle. How money is released at each gate is covered in program financial management.
- Set the review rule.
We review at each quarterly steering meeting and whenever any component date moves, and we re-run the slip test each time. Detailed sub-plans stay in the program management plan, and the roadmap stays a single view. How dependency risk is handled once the roadmap exists is covered in program risk management.
Why do roadmaps fail?
In our view, the commonest cause of failure is a project timeline with a program label. We see four faults, each with a test you can run before you issue the roadmap.
- A relabelled Gantt chart. Test: is there a "benefit lands" column with a date? Fail if bars end at delivery and nothing follows.
- Benefits with no owner. Test: does every benefit name one person, below sponsor level, who signs off that it has landed? Fail on "business", "TBD" or the delivery lead.
- A constant lag. Test: are fixed-date events marked, and does every component due within one quarter of one carry a flag? Fail if lag is one number for the whole program.
- No re-baselining. Re-baselining means formally resetting planned dates after an approved change. Test: does the roadmap show a version date and the last change approved? Fail if dates are overwritten without a record. Approval of a change should sit with the governance body named in the program management plan; our program governance framework shows how to set those decision rights.
A fifth fault is hiding non-project work. In the example, C1 and C5 are ₹3 crore, 10% of the ₹30 crore, and a project timeline often leaves them off.

Which Augment Consultancy course gives a foundation for program roadmaps?
Program Management Essentials is our foundation course in program management, with structured modules that build program management skills step by step. It is priced at US$99 per enrolment as of November 2026, and pricing varies by market. It is not preparation for the Program Management Professional (PgMP®) exam.
It suits professionals who want a grounded base in program practice before applying it to a roadmap like the one above. You can see the course and its current price in our course store.
If you would like to talk through your goals first, we offer a free discovery consultation before enrolment. It does not itself enrol you in a paid program. Write to support@augmentconsultancy.com or call or WhatsApp +91 9816 360 116.
Frequently asked questions
Sources
- 1.Benefits – a necessity to deliver business value and a culture change but how do we achieve them?, Levin, G., PMI Global Congress paper, 2015
- 2.Major Projects Annual Report 2025-26, NISTA, GOV.UK. Contains public sector information licensed under the Open Government Licence v3.0., 13 July 2026